![Signals From [Space]](https://substackcdn.com/image/fetch/w_80,h_80,c_fill,f_webp,q_auto:good,fl_progressive:steep,g_auto/https%3A%2F%2Fsubstack-post-media.s3.amazonaws.com%2Fpublic%2Fimages%2F55686857-6b99-45a6-ac0f-09c9f023f2a0_500x500.png)
![Signals From [Space]](https://substackcdn.com/image/fetch/e_trim:10:white/e_trim:10:transparent/h_72,c_limit,f_auto,q_auto:good,fl_progressive:steep/https%3A%2F%2Fsubstack-post-media.s3.amazonaws.com%2Fpublic%2Fimages%2F4d588ac1-7fac-4bd4-829d-fc7b4e8f1326_1512x288.png)

![Signals From [Space]](https://substackcdn.com/image/fetch/w_152,h_152,c_fill,f_auto,q_auto:good,fl_progressive:steep,g_auto/https%3A%2F%2Fsubstack-post-media.s3.amazonaws.com%2Fpublic%2Fimages%2F8786bff5-c5ae-44df-b73b-1922100d2fd2_1750x1750.png)

Home dialysis is a promising option for many patients with kidney disease, but barriers persist in adoption. In July, I wrote about hurdles highlighted in the IM-HOME study, including limited patient education and provider awareness, lack of support from healthcare systems, and logistical barriers like training and equipment access to name a few. These barriers prevent more patients from choosing home dialysis, despite its benefits for improving quality of life and outcomes.1
No two patient journeys are the same. As much time as we spend talking about how big of a problem kidney disease is in this country, and for good reason, the reality is our current built-for-scale kidney care system misses the trees for the forest. Doing a complex, live-sustaining treatment “on your own'“ at home is scary. But how does someone get from “I need dialysis” to “I can do dialysis at home?”
…the top 3 barriers cited by patients and caregivers included fear of performing dialysis at home, lack of space, and the need for home-based support. On the other hand, providers identified poor patient education, limited support staff, and lack of experienced staff as the primary obstacles.
Measuring Progress
The latest USRDS report contains data from FFS claims through 2022 and Medicare Advantage (MA) data through 2021. In some cases, it even contains ESRD metrics through 2023. Together, these annual reports give us a sense of how we’re doing across the kidney ecosystem, from CKD to ESKD, leveraging a range of datasets and partner resources spanning NIH, CMS, OPTN, the ESRD networks, and more.
Today, I thought I’d share a few observations, takeaways, and questions with all of you after reading through the home dialysis chapter— and invite you to weigh-in and share your personal perspectives, reflections, and hopes.
Here are a few thoughts, in no particular order.
Observations
1. Home Dialysis Use Continues Its Uphill Climb in the U.S.
From 2012 to 2022, the percentage of incident ESRD patients using home dialysis grew by over 70%, from 8.5% to 14.5%. This growth, primarily driven by peritoneal dialysis (PD), slowed slightly during periods of PD solution shortages (mid-decade) and the COVID-19 pandemic. Several factors influence home dialysis adoption, including age, race, primary cause of ESRD, and neighborhood social deprivation index, or SDI.


Pro tip: you can toggle most figures in the ADR to see how each of these factors impacts growth across home modalities.Key Points:
70% increase in home dialysis use among incident ESRD patients from 2012 to 2022, with PD as the primary contributor to this growth.
42% increase in home dialysis use among prevalent ESRD patients, with PD rising from 8.8% to 12.1% and home HD from 1.5% to 2.4% over the same time period.
Home dialysis is more common in rural areas and among individuals living in less socioeconomically deprived neighborhoods.2 There are two great figures in the report showing PD use by HSA (Fig 2.3a) and HHD use by state (2.3b) that help drive this point home.
ETC model impact: Markets assigned to the ESRD Treatment Choices (ETC) model showed higher adoption of home dialysis in 2022 and 2023, compared to non-ETC markets (see Fig 2.2).
Racial and ethnic disparities: White and Asian individuals have higher rates of home dialysis use compared to Black and Hispanic populations, especially for PD.
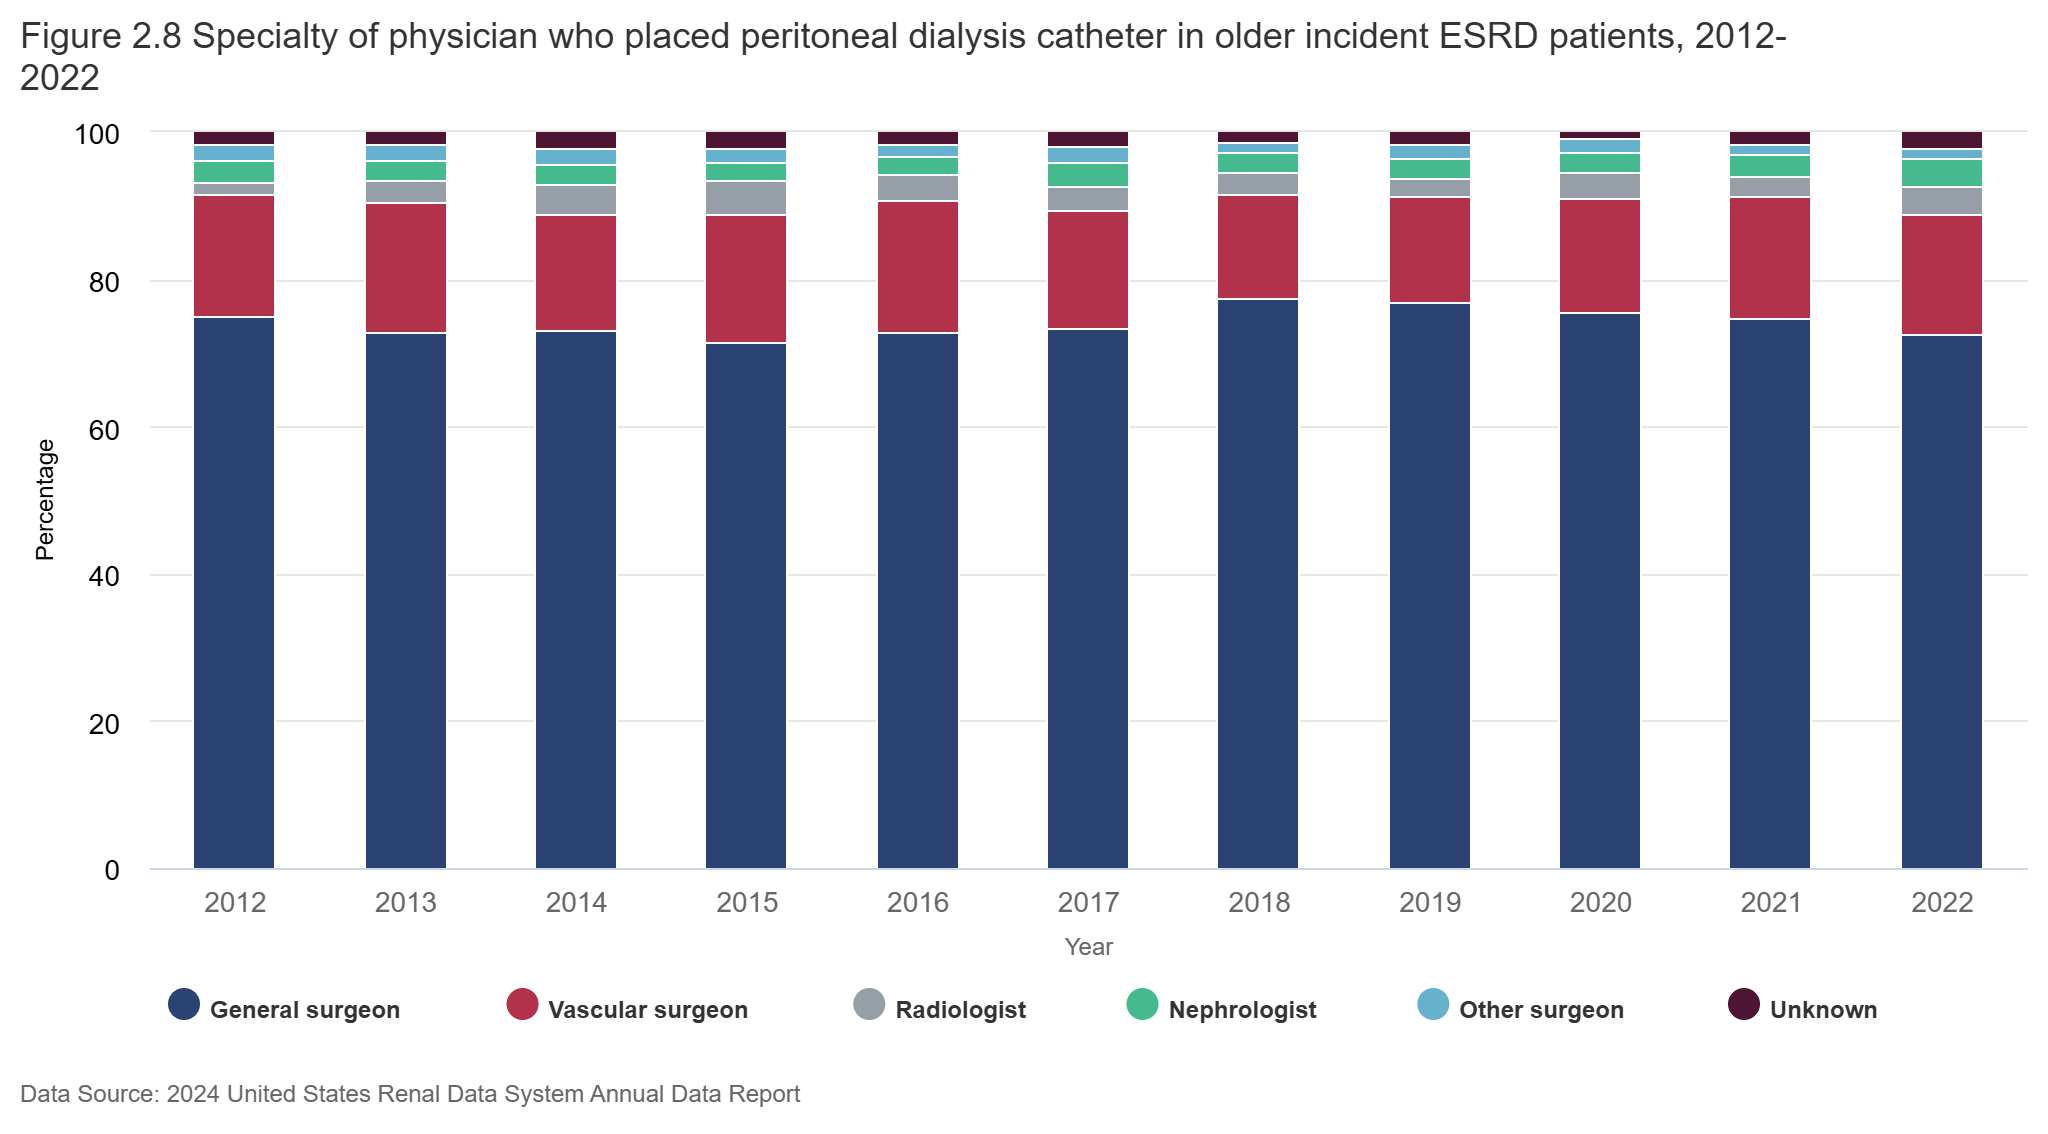
2. Nephrologists Placed 4% of Peritoneal Dialysis Catheters in 2022, the Most They’ve Done in a Decade
In order to expand the use of peritoneal dialysis (PD), having proficient operators who can place PD access is crucial. According to the 2024 ADR, nephrologists placed just 4% of PD catheters in 2022, while the vast majority (89%) were placed by general surgeons (72.5%) and vascular surgeons (16.4%). While the distribution of physician specialties for PD catheter placement has remained fairly consistent over time, there has been a slight increase in the involvement of radiologists. As PD continues to grow, ensuring that nephrologists are more involved in this aspect of care will be an important step in improving accessibility and quality of treatment.3
Key Points:
General surgeons place 72.5% of PD catheters, while nephrologists placed only 3.9% in 2022. That ratio has largely held constant for a decade; though, 2022 was the highest share of placements done by nephrologists in that time period (9 out of 10 years were in the 2-s).
Radiologists and vascular surgeons play a significant role here, with radiologists placing a similar amount to nephrologists (3.8%) and vascular surgeons responsible for the second-most at 16.4%.
An uptick for nephrology? If PD represents the go-to growth lever for home, and nephrologists seem to be doing more of these procedures, what do you expect to see for 2023-present? Is the access field changing, and if so how?
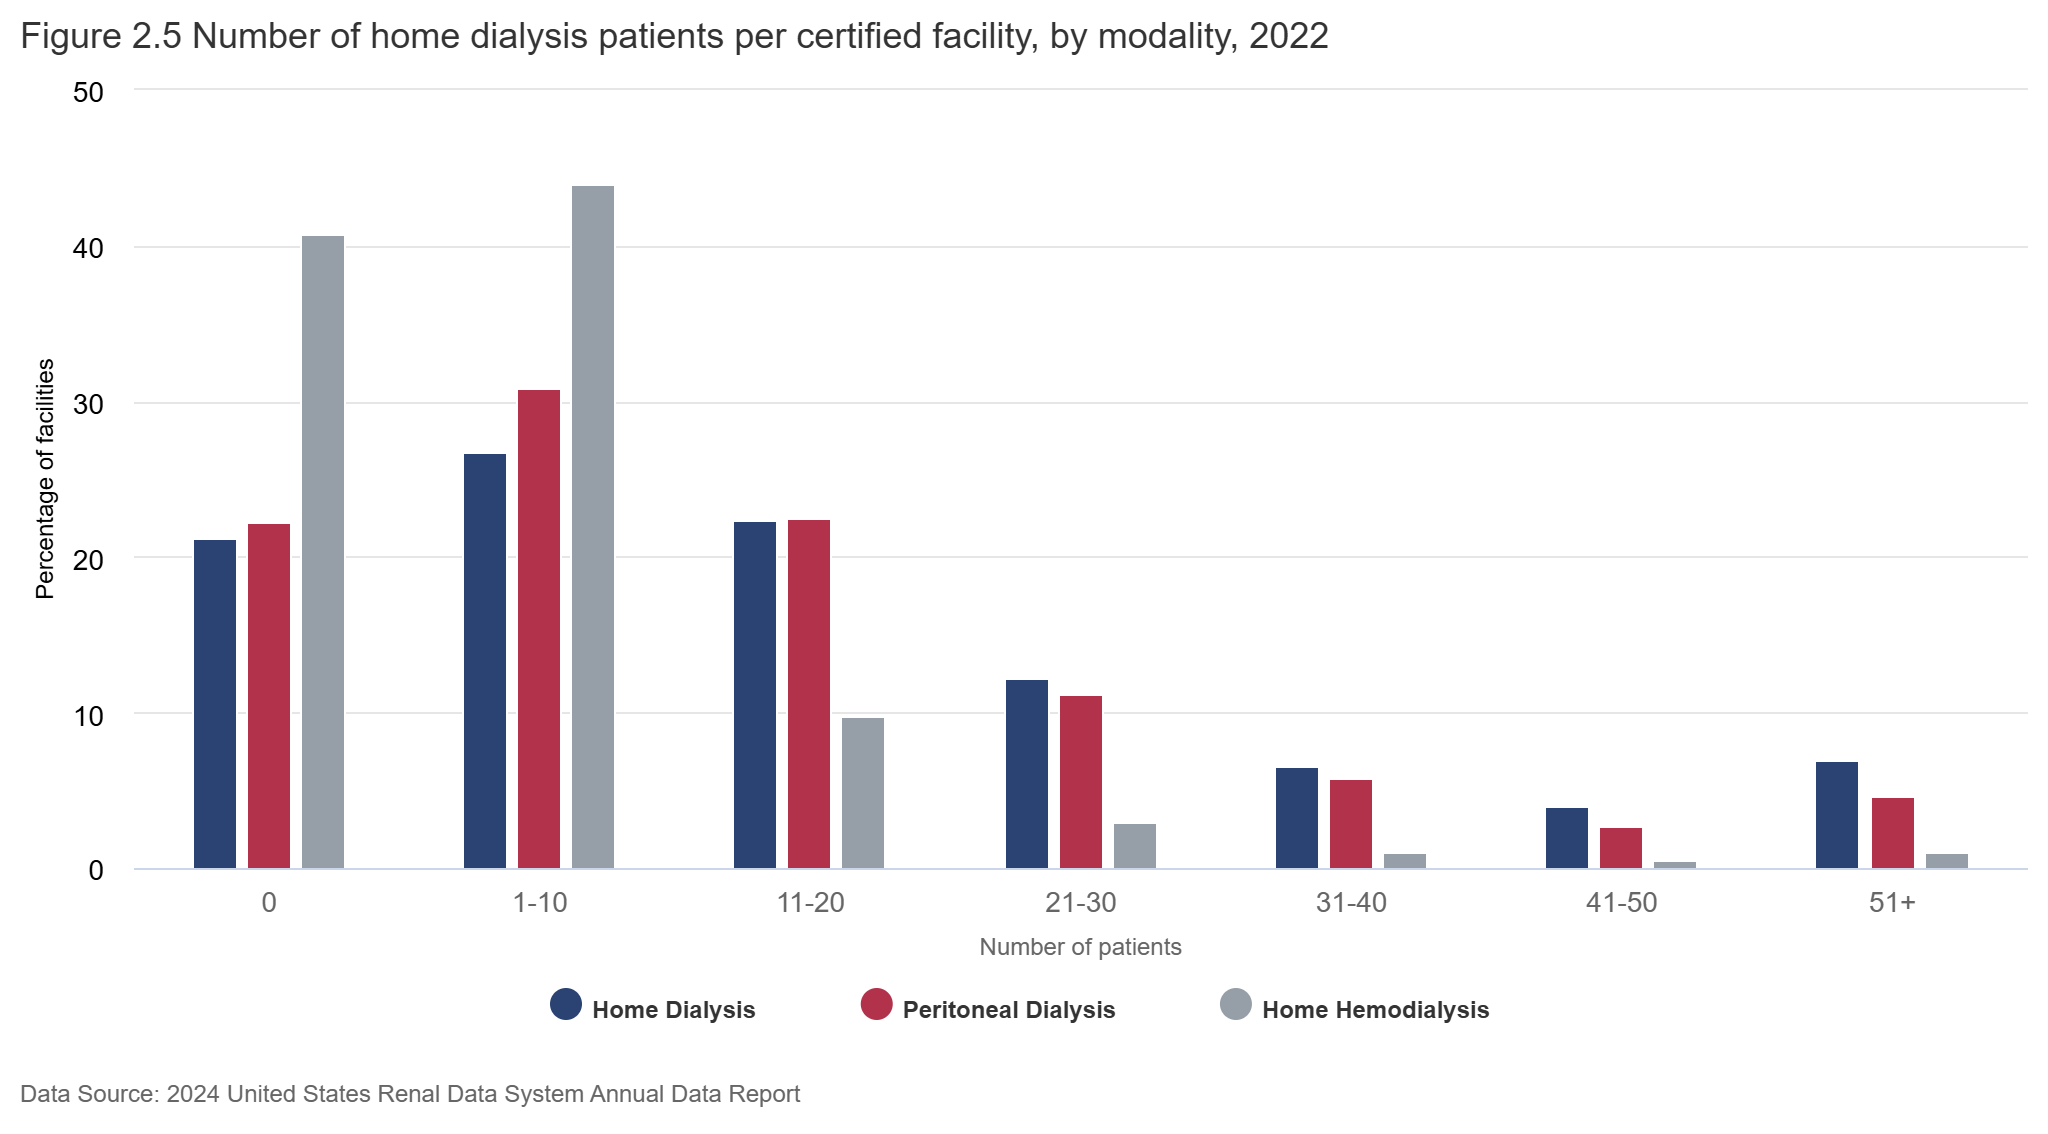
3. The Number of Facilities Offering Home Dialysis is Increasing; So Are Programs Without Active Home Patients
The report opens with this salient point: growing home dialysis requires adequate infrastructure and human capital. Dialysis facilities must be certified to offer—and deliver—home dialysis. Between 2017 and 2021, the number of dialysis facilities grew by 10%, while the number offering home dialysis grew by 9%. However, despite these increases, the proportion of facilities offering home dialysis remained relatively unchanged. A small but steady rise in certified facilities without active patients is noteworthy. Additionally, more facilities offer peritoneal dialysis (PD) than home hemodialysis (HD), with similar proportions of each type certified without active patients.
Key Points:
10% growth in total dialysis facilities from 2017-2021, paired with a 9% increase in facilities with active home dialysis patients. Essentially unchanged in 2022.
3% growth in certified facilities without active home dialysis patients. That’s from 897 facilities in 2017 to 924 facilities in 2022.
Very little change in the distribution of facilities in each category: 46.6% of facilities (3,798 clinics) were not certified to offer home dialysis in 2022.
40.1% of facilities offered peritoneal dialysis (PD), while 17.3% offered home HD. The percentages of certified facilities without active patients were similar for PD (11.5%) and home HD (11.9%).
4. Payer Matters: Insurance Impacts Outcomes Across Care Settings and Modalities, Especially Among MSPs
The 2024 ADR introduces payer types as a stratification for dialysis trends in several figures. The four figures below highlight key differences in access to all ESRD treatment modalities—home dialysis (PD and Home HD), conversions from home dialysis to in-center, and transplant waitlisting—by insurance coverage.

